Tutorial – Systems Failure Analysis: The Fault Tree Methodology
One of the things that make continuous improvement efforts simultaneously stimulating and frustrating is what often seems to be a constant stream of problems. Strong problem solving skills are essential to successful continuous improvement activities. Without these skills one is doomed to solving the same problems repeatedly. This paper presents a methodology for identifying and eliminating problem root causes, and specifically, the root causes of complex systems failures.
What is A Systems Failure?
Our discussion begins with systems failure and systems failure analysis definitions. A systems failure occurs when a system does not meet its requirements. A laser failing to designate its target, an aerial refueling system failing to transfer fuel at the proper flow rate, a blood chemistry analyzer failing to provide accurate test results, a munition that detonates prematurely, and other similar conditions are all systems failures.
Systems Failure Analysis Process
A systems failure analysis is an investigation to determine the underlying reasons for the nonconformance to system requirements. A systems failure analysis is performed to identify nonconformance root causes and to recommend appropriate corrective actions.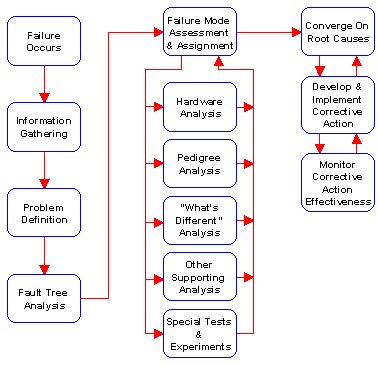
Figure 1. The Systems Failure Analysis Process. This approach assures root cause identification and effective corrective action implementation.
Figure 1 shows our recommended systems failure analysis approach. Systems failure analysis begins with a clear understanding of the failure (i.e., a definition of the problem). Once this has been accomplished, all potential failure causes are identified using fault tree analysis. The process than objectively evaluates each of the potential failure causes using several techniques, including “what’s different” analysis, pedigree analysis, failed hardware analysis, and designed experiments. These techniques help in converging on the causes of failure among many identified potential causes. Once the failure causes have been identified, the approach outlined herein develops a range of corrective actions and then selects and tracks optimum corrective action implementation.
Fault Tree Analysis: Identifying All Potential Failure Causes
Methodology: When confronted with a systems failure, there is often a natural tendency to begin disassembling hardware to search for the cause. This is a poor approach. Failed hardware can reveal valuable information and safeguards are necessary to prevent losing that information from careless teardown procedures. One must know what to look for prior to disassembling failed hardware. This is where fault tree analysis enters the picture.
Fault tree analysis is a graphical technique that identifies all potential failure causes. The approach was developed in the early 1960s by Bell Laboratories working with the U.S. Air Force and Boeing on the Minuteman missile development program. When developing this system, Boeing and the Air Force were concerned about inadvertently launching a nuclear missile. The Air Force needed a technique that could analyze the missile, its launch system, the crew, and all other aspects of the complete weapon system to identify all potential causes of an inadvertent launch. Bell Laboratories developed the fault tree technique for this purpose.
The fault tree starts with a top undesired event, which is the system failure mode for which one is attempting to identify all potential causes. The analysis then continues to sequentially develop all potential causes.
Example: We’ll examine a simple example to see how this is done, but first, let’s consider fault tree analysis symbology. Figure 2 shows the symbols used by the fault tree. There are two categories of symbols: events and gates. Let’s first consider the four different symbols for events. The rectangle is called a command event, and it represents a condition that is induced by the events immediately below it (we’ll see how shortly). The circle represents a basic failure event (these are typically component failures, such as a resistor failing open, or a structural member cracking). The house represents a normally occurring event (for example, if electrical power is normally present on a power line, the house would be used to represent this event). The last event symbol is the diamond (it looks like a rectangle with the corners removed), which can represent either a human error or an undeveloped event. A human error might be a pilot’s failure to extend the landing gear when landing an aircraft, a technician’s failure to properly adjust a variable resistor, or a crew member inadvertently depressing a self-destruct button on a missile control console. An undeveloped event is one that requires no further development. Usually command events considered extremely unlikely are designated as undeveloped events to show that they have been considered and eliminated as a possible failure causes. Fault tree events are linked by gates to show the relationships between the events. There are two types of gates: “and” gates, and “or” gates. The “and” gate signifies that all events beneath it must occur simultaneously to result in the event above it. The “or” gate means that if any of the events beneath it occur, the event above it will result.
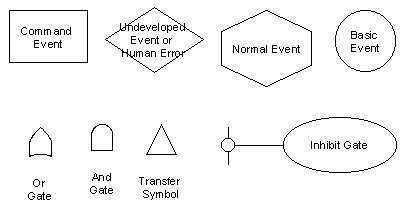
Figure 2. Fault Tree Symbology. Different symbols represent events and logic gates.
The best approach for developing the fault tree is to assemble a team consisting of personnel with a good understanding of how the system is supposed to operate and associated support functions. The team should typically include an engineer, a quality engineer, a manufacturing engineer, an assembly technician, and perhaps others, depending on the nature of the failure.
Let’s now examine how all of the above comes together to generate a fault tree analysis. We’ll consider a simple systems failure analysis. Suppose we have a system with a light bulb that screws into a socket, and the light bulb illuminates when someone turns a switch on. Figure 3 shows a schematic for this system. One day, we flip the switch and the light bulb does not come on.
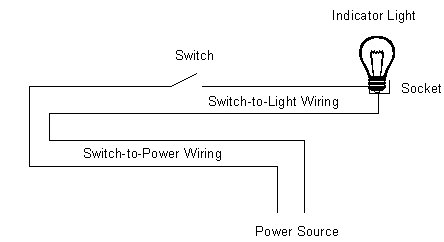
Figure 3. Light Bulb Wiring Schematic. This is the system for which we’ll prepare a fault tree analysis.
The first step is to define the problem. The problem here is that the light bulb does not illuminate. This becomes the top undesired event in the fault tree for this system failure, and Figure 4 shows it in a command event (the rectangle symbol). Top undesired events are always shown in a command event symbol, as they will be commanded to occur by events in the tree below.
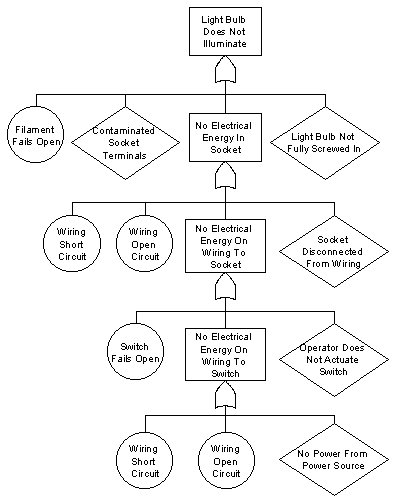
Figure 4. Indicator Light Fault Tree Analysis. This simple fault tree develops potential causes for an indicator light system failing to illuminate.
The next step is to look for the immediately adjacent causes that can induce the top undesired event. This is a critically important concept. A common shortcoming is to jump around in the system, and start listing things like a power loss in the building, a failed switch, and perhaps other events, but the fault tree requires discipline. One has to look for the internal or immediately adjacent causes. An approach for doing this is to imagine yourself as the light bulb, screwed into the socket, and ask “what can happen in me or right next to me to prevent me from illuminating?” If one considers only these conditions, the answers are:
- An open light bulb filament
- Contaminated terminals in the socket
- A bulb that’s not fully screwed into the socket
- No electrical energy from the socket
We show these events immediately below the top undesired event and determine which symbol is appropriate for each. The open filament is a basic component failure, so it goes in a circle symbol. Contaminated terminals in the socket could be caused by a variety of conditions, but for the purposes of this analysis we won’t fully develop these, and we’ll put contaminated terminals in an undeveloped event symbol (the diamond). Not fully screwing the bulb into the socket is a human error, so it goes into a human error symbol (also a diamond). Finally, no energy from the socket is a condition that will be commanded to occur if other events occur elsewhere in the system. This event becomes a command event, and it goes into a rectangle.
The above events are all of the internal or immediately adjacent conditions that can cause the light bulb to fail to illuminate, and this nearly completes the first tier of the fault tree for this undesired event. To complete this tier, we have to link these internal and immediately adjacent events to the command event above them. Either an “and” gate or an “or” gate will be used. The question is: Will any of the events below the top undesired event result in the top undesired event, or are all events below the top undesired event required to result in the top undesired event? In this analysis, any of the events below the top undesired event will result in the light bulb failing to illuminate, so the “or” gate is selected.
The fault tree analysis continues by developing the potential causes for the next command event, which in this case is the event that appears below the top undesired event on the fault tree’s first tier: No electrical energy available in the socket. We now need to identify all conditions internal to and immediately adjacent to the socket. In this case, the socket can be disconnected from the wiring, or the wiring can have no power delivered to it, or the wiring could have a short circuit, or the wiring could break open. The socket being disconnected from the wiring would probably be the result of a human error, so this event is shown in a diamond. The wiring having a short circuit is a basic component failure (the wiring insulation fails), so it is shown in a circle. The same is true for the wiring failing open. No power to the wiring is commanded to occur by conditions elsewhere in the system, so it is shown as a command event. Any of these conditions can cause the command event immediately above them (no electrical energy in the socket), so an “or” gate is used to show the relationship.
We continue the analysis by identifying all internal or immediately adjacent conditions to the wiring. The internal wiring conditions have already been addressed (the wiring failing open or having a short circuit), so only the immediately adjacent conditions need be shown. This brings us to the next element in the circuit, which is the switch. The switch can fail open (this is a basic switch component failure, so it’s shown in a circle). The switch can have no power delivered to it (this is a command event). Finally, the system operator might forget to turn the switch on (this is a human error). Any of these conditions can induce the “no power to wiring” command event shown immediately above these events, so again, an “or” gate is used.
The same kind of wiring failures are shown for the wiring leading from the electrical power source to the switch (these are similar to the types of failures we developed for the wiring earlier). The only other condition that can cause no power to this set of wiring is no power from the power source. Since there is no additional information about the power source, it is shown as an undeveloped event. Any of the conditions can induce no power on the wiring, so an “or” gate is used.
At this point, the fault tree logic for our simple example is completed. What does this mean? With the data available, the fault tree started with a definition of the failure (which became the top undesired event in the fault tree) and systematically developed all potential causes of the failure. It is important to note that the fault tree logic development started at the point the failure appeared (in this case, a light bulb that failed to illuminate), and then progressed through the system in a disciplined and systematic manner. The fault tree logic followed the system design. Systematically working from one point to the next when constructing a fault tree forces the analyst to consider each part of the system and all system interfaces (such as where the switch interfaced with a human being). This is key to successful fault tree construction, and in taking advantage of the fault tree’s ability to help identify all potential failure causes.
Before leaving the fault tree, there’s one more task, and that’s assigning a unique number to each of the basic events, human errors, normal events, and undeveloped events. These will be used for tracking purposes in a management tool called the failure mode assessment and assignment matrix, which will be explained in the next section.
The Failure Mode Assessment and Assignment Matrix
After completing the fault tree, the next step is to prepare the failure mode assessment and assignment matrix (the FMA&A). As Figure 5 shows, the FMA&A is a four column matrix that identifies the fault tree event number, the fault tree event description, an assessment of the likelihood of each event, and what needs to be done to evaluate each event. The FMA&A becomes a table based on the outputs of the fault tree that lists each potential failure mode. Figure 5 shows an FMA&A prepared for the indicator light fault tree analysis developed in the preceding pages. The FMA&A shown in Figure 5 shows what actions are required for evaluating each indicator light potential failure cause, and it provides a means of keeping track of the status of these actions.
| Event | Description | Assessment | Assignment |
|---|---|---|---|
| 1 | Filament Open | Unknown | Examine bulb for open filament. Rodriguez; 16 March 93 |
| 2 | Contaminated Socket Terminals | Unknown | Examine socket for contaminants. Perform FTIR analysis on any contaminants observed in socket. Rodriguez; 16 March 1993 . |
| 3 | Light Bulb Not Fully Screwed In | Unknown | Inspect bulb in socket to determine if properly installed. Smith; 14 March 1993. |
| 4 | Socket Disconnected From Wiring | Unknown | Examine wiring and perform continuity test. Ashoggi; 16 March 1993. |
| 5 | Wiring Short Circuit | Unknown | Examine wiring and perform continuity test. Ashoggi; 16 March 1993. |
| 6 | Wiring Open Circuit | Unknown | Examine wiring and perform continuity test. Ashoggi; 16 March 1993. |
| 7 | Operator Does Not Activate Switch | Unknown | Interview operator and check switch function. Rodriguez; 16 March 1993. |
| 8 | Switch Fails Open | Unknown | Check switch function. Rodriguez; 16 March 1993. |
| 9 | Wiring Short Circuit | Unknown | Examine wiring and perform continuity test. Ashoggi; 16 March 1993. |
| 10 | Wiring Open Circuit | Unknown | Examine wiring and perform continuity test. Ashoggi; 16 March 1993. |
| 11 | No Power From Power Source | Unknown | Check power supply with multimeter. Ashoggi; 14 March 1993. |
Figure 5. Failure Mode Assessment and Assignment Matrix for the Indicator Light Failure Analysis. The FMA&A matrix identifies potential failure causes, likelihood assessments, and assigned investigatory actions.
The third column in the FMA&A, the likelihood assessment, lists the failure analysis team’s assessment of each potential failure cause being the actual cause of the failure. Usually, failure analysis teams list each hypothesized failure cause as likely, unlikely, or unknown. When the FMA&A matrix is first prepared, most of the entries in this column should be listed as unknown, since at this point no work beyond the fault tree construction and initiation of the FMA&A has been started.
The last FMA&A column (the assignment column) lists the assignments agreed to by the failure analysis team members to evaluate whether each hypothesized failure mode actually caused the observed failure. This ties back to our earlier discussion in which we advised against tearing a system apart immediately after a failure without knowing what to look for. The fault tree and FMA&A provides this information. These analysis tools reveal to the analysts what to look for when disassembling the system, as well as when conducting other activities to evaluate the likelihood of each potential failure cause. The assignment column of the FMA&A defines the actions necessary to look for and determine if each hypothesized failure cause did or did not contribute to the failure. We recommend that failure analysis team members also indicate in the fourth FMA&A column who has responsibility for each assignment and required completion dates for these assignments. The assignment column is also used for general comments describing progress in evaluating each event, significant findings, and other information. A review of this column should provide a general indication of an ongoing failure analysis’ status.
Most people find it effective to update the FMA&A during failure analysis meetings instead of taking notes, editing the FMA&A after the meeting, and distributing the FMA&A at some later date. Most word processing packages include a tables feature, and if possible, a computer should be used during the meeting to update the failure analysis status in real time. In this manner, an updated FMA&A can be printed immediately at the end of each failure analysis meeting (this helps to keep the failure analysis team members focused and sustain failure analysis momentum).
Supporting Analyses
Once the failure analysis team has completed the above steps, the team has a fault tree that identifies each potential failure cause and an FMA&A that provides a management tool for evaluating each potential cause. At this point, it becomes necessary to turn to the family of supporting technologies shown in Figure 1 to complete the FMA&A, and in so doing, converge on the true failure causes. Each of these are discussed below.
“What’s Different?” Analysis
The “what’s different?” analysis is a technique that identifies changes that might have induced the failure. The basic premise of this analysis is that the system has been performing satisfactorily until the failure occurred; therefore, something must have changed to induce the failure. Potential changes include system design, manufacturing processes, suppliers, operators, hardware lots, and perhaps other factors.
The “what’s different?” analysis will almost certainly identify changes. As changes are identified they should evaluated against the potential failure causes identified in the FMA&A. One has to do this in a systematic manner. Changes are always being introduced, and when a change is discovered, it doesn’t necessarily mean that it caused the failure.
Design changes can be identified by talking to the engineers assigned to the system. Procurement specialists should be asked to talk to suppliers, as changes may have occurred in procured components or subassemblies. We’ve found that it also makes sense to talk to the people responsible for maintaining the engineering drawings (this function is normally called configuration management or document control). The people responsible for maintaining the engineering design package normally keep records of all design changes, and they can frequently identify changes the design engineers may not remember. Manufacturing process changes are sometimes more difficult to identify. Assembly technicians, their supervisors, and inspectors may be able to provide information on process changes. The manufacturing engineers and quality engineers assigned to the system may have information on process changes. Most companies have written work instructions, and sometimes records are kept when these documents are changed, so the work instruction history should also be researched. Tooling changes can be similarly identified. Companies often keep tooling release records, so these, too, should be reviewed. Here’s another tip: Look around the work area for tools not identified in the assembly instructions or otherwise authorized. Sometimes manufacturing personnel use their own tools, and these might be changed without any documentation.
If the system in which the failure occurred was manufactured in a facility that uses statistical process control, process changes may be more readily available. Ordinarily, process changes are noted on statistical process control charts.
Another area to search for potential changes is in the system operating environment. Sometimes a subtle environment change is enough to induce a failure. It makes sense to evaluate the environment in which the failed system operated against the environmental capabilities of the system. Even though the system may have been operating in its specified environment when the failure occurred, it is not unusual to discover that as a result of a design oversight, one or more of the system’s components or subassemblies are being asked to operate outside of their rated environment. For example, power supplies in enclosed electronic cabinets may be operating in temperatures higher than the designer intended.
Before leaving the “what’s different?” analysis, a few caveats are in order. Recall that at the beginning of this discussion we identified a basic premise, which was that a change occurred to induce the failure. This may not be the case. Sometimes nothing has changed and the failure resulted from normal statistical variation. There’s another possibility, and that is that the failure may have been occurring all along, but it was not previously detected.
Pedigree Analysis
Pedigree analysis examines all paperwork related to the components and subassemblies identified in the fault tree and the FMA&A. Due to normal quality assurance and other record keeping requirements, most companies have a fairly extensive paper trail. Pedigree analysis involves studying this paperwork to determine if it shows that the components and subassemblies identified in the fault tree meet requirements. This paperwork can include test data, inspection data, raw material data sheets, and other certifications.
The data described above should be examined for evidence showing nonconformances or other inconsistencies. It’s not uncommon for test or inspection sheets to show that a part or subassembly did not meet requirements but was accepted in error.
Again, one has to be on guard for unrelated findings. We recommend only examining the data for the parts or subassemblies identified by the fault tree analysis (and consequently, the FMA&A). Since the fault tree identifies all potential causes of the observed failure, it isn’t necessary to explore other data. If a nonconformance is indicated in the data sheets, it should be addressed, but the nonconformance has to be compared to the fault-tree-identified potential failure cause. Nonconforming conditions may not have caused the failure (we’ve found that when performing pedigree analysis, one often finds other problems). These need to be corrected, but they may not be related to the systems failure being analyzed. Pedigree analysis should also review prior quality records for the system and all components and subassemblies identified by the fault tree as potential failure causes to identify any prior similar failures. In many cases, specific systems failure modes will not be new, and reviewing the findings of previous analyses will support the failure analysis process.
Designed Experiments
Designed experiments can include tests designed to induce a failure or special tests based on analysis of variance or other statistical techniques. Tests designed to induce a failure can often be used to evaluate a hypothesized failure cause. By configuring the hardware with the hypothesized failure cause present, one can determine if the previously-observed failure mode results (i.e., the one that initiated the systems failure analysis). The disadvantage of this type of test is that it tends to require absolute failure causes (in other words, the hypothesized failure cause must induce the observed failure mode all of the time). In many cases, hypothesized failure modes can induce the observed failure mode, but they may not do so all of the time. Another disadvantage of this type of test is that it can typically only evaluate one hypothesized failure cause at a time. In so doing, the effects of other contributory conditions often cannot be evaluated.
Taguchi tests (a specialized analysis of variance technique) are useful for evaluating the effects of several variables and their interactions simultaneously with a minimum number of test samples. Frequently, when evaluating all of the hypothesized failure causes in the FMA&A, one eliminates most of the causes but several remain. In many instances, more than one of the remaining hypothesized failure causes contributes to the failure. Because the Taguchi test technique evaluates several variables simultaneously, it can be used for assessing the relative impact of each of the remaining potential failure causes.
Hardware Analysis
We want to again emphasize deferring failed hardware analysis until after all potential failure modes have been identified and the failure analyst knows exactly what to look for in the failed hardware. The fault tree analysis and FMA&A allow development of a logical hardware teardown and inspection process. We recommend using this information to prepare written disassembly instructions and an inspection data sheet. Photodocumenting the disassembly process and all hardware as the analysis progresses also makes sense. The analyst may later become aware of additional potential failure causes, and photodocumenting the teardown process allows one to re-examine the hardware as it was removed from the system. There are several tools available to assist the hardware analysis. These fall into several categories: magnification equipment, material analysis equipment, general measuring equipment (used for evaluating compliance to engineering design requirements), x-ray systems, and other specialty equipment.
Optical microscopes and scanning electron microscopes are two magnification tools that have gained wide acceptance. Optical microscopes are available in most companies, and they permit greatly magnified observations of suspect components. Sometimes tiny defects or witness marks that cannot be seen with the naked eye are visible under magnification (these defects or other marks often support or refute hypothesized failure causes). If greater magnification is required, the scanning electron microscope has proven to be a valuable tool. Scanning electron microscopes bounce electrons off the surface being examined to produce an image, and they can magnify images up to one million times their actual size. Scanning electron microscopes are generally available in larger companies, and there are many commercial metallurgical and other failure analysis laboratories that offer this capability.
The most common material analysis tools are energy dispersive x-ray analysis, Fourier transform infrared spectroscopy, and other forms of spectroscopy. The operating principles of these tools and their limitations are beyond the scope of this article, but the analyst should recognize that such tools are available (perhaps not in your organization, but certainly in others specializing in this business). Materials analysis tools help to evaluate if the correct materials were used, or if contaminants are present.
General measuring equipment consists of the standard rules, micrometers, gages, hardness testers, scales, optical comparators, and coordinate measuring machines available in almost every organizations’ quality assurance department. This is where quality assurance failure analysis team members can lend tremendous support. For most systems failures, the fault tree analysis and FMA&A will identify many components, which, if nonconforming, could have caused the failure. The quality assurance organization can support the failure analysis effort by inspecting each of the components hypothesized as potential failure causes to determine compliance with the engineering design.
X-ray analysis is frequently useful for determining if subsurface or other hidden defects exist. X-rays can be used for identifying weld defects, internal structural flaws, or the relationship of components inside closed structures. This technique is particularly valuable for observing the relationships among components in closed structures prior to beginning the disassembly process. Sometimes the disassembly process disturbs these relationships (especially if the structure was not designed to be disassembled), and x-rays can reveal information not otherwise available. X-ray services (including portable x-rays) are usually available through commercial failure analysis laboratories.
Videotaping or filming moving machinery is another specialized technique that can reveal interactions not readily apparent when the machinery is stationary. Many videotapes and film projectors allow the film to be shown in slow motion, which also helps to evaluate potential failure modes.
All of the failed hardware should be identified and bonded so that it is available at a later time if the need arises. Sometimes new potential failure modes are identified as the failure analysis progresses and it might become necessary to re-evaluate hardware previously examined. We recommend keeping failed hardware until corrective action has been implemented and its effectiveness in eliminating failures is confirmed.
Moving Toward Failure Analysis Completion
As the potential failure causes identified by the fault tree analysis and the FMA&A are evaluated, what typically occurs is most of the potential failure causes are ruled out. In most cases, a few potential causes remain. One approach is to perform additional specialized testing as described earlier to converge on the actual cause or causes of failure. Another approach is to implement a set of corrective actions that addresses each of the remaining unconfirmed potential failure causes. Either approach is acceptable, although one should take precautions to assure that the selected corrective actions do not induce other system problems. In most cases, failure analysis teams will find a confirmed failure cause during their systematic evaluation of each potential failure cause in the FMA&A. The natural tendency is to conclude the failure analysis as soon as a confirmed failure cause is found without continuing to evaluate the remaining potential failure causes contained in the FMA&A. We advise against concluding the failure analysis until all potential causes are evaluated. The reason for this is that multiple failure causes frequently exist. In a recent circuit card failure analysis, the failure analysis team performed a fault tree analysis and identified 87 potential failure causes. In systematically evaluating each of these, the team found that six of the potential causes were actually present. Any one of these failures was sufficient to induce the failure mode exhibited by the circuit card. If the team stopped when they confirmed the first cause, the other five causes would have remained, and the circuit card failures would continue to recur.
Identifying, Selecting, and Implementing Corrective Action
There are usually multiple corrective action options. The most preferable corrective actions are those that eliminate failure root causes through redesign. In so doing, these corrective actions totally eliminate reliance on people to perform in a specific manner such that the problem is eliminated (a practice often referred to as making a product, process, or service “idiot proof”). The least preferable corrective actions are those that do not eliminate the problem at its root cause, but instead rely on people to perform special actions to guard against the problem recurring. The corrective action order of precedence (starting with the most preferable to the least preferable category of problem solutions) is described below.
- Design Upgrades To Eliminate Or Mitigate The Problem. This category of corrective actions modifies the product, process, or service to eliminate the features that induced the problem. When a product, process, or service is modified to eliminate the feature inducing the problem, the problem is attacked at its root cause.
- Requirements Relaxation. In many instances, a problem is only a problem because the product, process, or service does not meet a specification. For example, the problem may be that a process has a yield of only 94 percent, when a yield of 95 percent is required by the customer. One solution is to negotiate a relaxation of the requirement such that a yield of 94 percent becomes acceptable. Obviously, such an approach is not entirely responsive to the customer’s requirements, and as such, it tends to depart from the TQM philosophy of focusing on customer needs and expectations. Nonetheless, under certain circumstances requirements relaxation may be the only practical approach, and as such, where requirements relaxation makes sense it should be considered.
- Training. In many instances, problems can be eliminated by providing training to customers, assemblers, or other personnel to control the circumstances that could induce a problem. One company we worked with experienced multiple instances of hydraulic fluid leakage on an aerial refueling system during system checkout prior to delivering the product to the customer. Application of the systems failure analysis process described in this paper revealed that hydraulic assembly personnel were unfamiliar with proper hydraulic line installation procedures. After training the hydraulic assembly personnel on proper hydraulic fitting and line installation techniques, the leakage rate during system checkout dropped significantly. Training might appear to not be as desirable a solution as would be redesigning the system such that it becomes insensitive to installation technique, but redesigning the aerial refueling system in this situation was not considered feasible by either the company producing the system or the customer.
- Additional Testing or Inspection. Under certain circumstances, falling back on sorting good product from bad through additional testing or inspection may be the most expedient solution. Again, this is counter to the TQM prevention (rather than detection) philosophy, and for that reason, additional testing or inspection is usually not an acceptable way of doing business other than in unusual circumstances. To illustrate the concept, we recall an example in which a munitions manufacturer procured a large number of detonators and found during acceptance testing that some of them were defective. The defect was induced by concavity in the detonator output surface, which resulted in a failure to reliably initiate an explosion (in this case, that’s what the device was supposed to do). The munitions manufacturer had to meet a tight delivery schedule with it customer, the U.S. Air Force. The solution to this problem was to inspect the entire group of detonators for surface flatness, and to only use those that were acceptably flat. That was the short term solution, and it was selected to allow continuing production until the problem was eliminated at its root cause. The long term solution (which eliminated the root cause) resulted from the munitions manufacturer working with the detonator manufacturer to modify the detonator production process. The process modification eliminated the process features that induced detonator concavity.
- Cautions or Warnings. Another category of solutions includes incorporating cautions or warnings on products or in related documentation to prevent problems. This is not a preferred solution, but there may be circumstances that require such a solution. We’ve probably all seen high voltage warnings on electrical equipment. Wouldn’t it be better to simply insulate the high voltage areas such that it became impossible to contact a high voltage surface? The answer, obviously, is yes, but doing so may not always be practical. Maintenance technicians may require access to the system when it is energized, and it may not be possible or practical to isolate or insulate high voltage surfaces inside an electrical device. Again, if it’s practical to eliminate the problem through a design change, then that it the most preferable solution.
- Special Operational or Process Actions. The last category, and the least preferable from a long term perspective, is to rely on special operational or process steps as a problem solution. When the U.S. Army procured Beretta 9mm service handguns, the initial shipments experienced structural failures after firing only a few thousand rounds. The Army’s interim solution was a special operational action, which required replacing the handguns’ slides after firing a specified number of rounds. The Army’s long term solution was to eliminate the metallurgical deficiency that allowed the failures to occur.
Although it may sometimes be necessary to implement less preferable solutions (due to economic or other reasons), in all cases the long-term solution should migrate toward a product or process change that eliminates the root cause of the problem.
Once corrective actions have been identified, evaluated, and selected, the final steps consist of implementing the corrective action and evaluating its effectiveness. This may seem so obvious as to almost be insulting, but our experience has shown that in many instances this last two crucial actions are not accomplished. This is particularly true in larger organizations, where it is sometimes easier to make assumptions about other people implementing corrective action. We recommend assigning specific actions to assure corrective action implementation, and monitoring the situation to assure that the problem has in fact been eliminated.
Summary
In many companies that manufacture complex systems, a more sophisticated approach is required to arrive at the root causes of systems failures. The approach presented in this paper offers sophisticated techniques for identifying potential failure causes and evaluating corrective actions. Fault tree analysis is used to define all potential causes of failure and the FMA&A is used to guide the systematic evaluation of each of these potential causes. Several supporting technologies (“what’s different” analysis, pedigree analysis, designed experiments, and hardware analysis) are used to assist in this systematic evaluation. Once the failure causes have been identified, corrective action options should be developed, evaluated, implemented, and evaluated again after implementation to assure the failure has been eliminated. The systems failure analysis process outlined in this paper provides a systematic approach for converging on the most likely failure causes and implementing effective corrective actions.
How to Learn More about It
Courses
Fault Tree Analysis and other techniques for system and component failure analysis are the subject of several Eogogics courses on Root Cause Failure Analysis (RCFA) including:
- Root Cause Analysis of Systems Failure: A Comprehensive Workshop (4-5 days, RCFA)
- Root Cause Analysis of Component Failure: Understanding Human and Engineering Factors for Improved Product Performance (2-4 days, RCFA-ME)
Books and Reports
- Systems Failure Analysis, Joseph Berk, Elsevier, 2008.
- Fault Tree Construction Guide, Armament Development Test Center United States Air Force, May 1974.
- Components Quality/Reliability Handbook, Intel Corporation, 1985.
- Taguchi Techniques for Quality Engineering, Philip J. Ross, McGraw-Hill Book Company, 1988.
- “Ordnance System Failure Analysis,” Joseph Berk and Larry Stewart, Proceedings of the Annual Reliability and Maintainability Symposium, 1987.
- Statistical Quality Design and Control, Richard Devor, Tsong-How Chang, and John Sutherland, MacMillan Publishing, 1992.
- Quality Management for the Technology Sector, Joseph and Susan Berk, Elsevier, 2001.
- Managing Effectively, Joseph and Susan Berk, Sterling Publishing Company, 1991.
Web Resources
- Society of Reliability Engineers: http://www.sre.org/
- American Society for Quality: http://www.asq.org/